Showing posts with label Total. Show all posts
Showing posts with label Total. Show all posts
Tuesday, May 2, 2017
Friday, June 21, 2013

How Total creates value for stakeholders (2012)
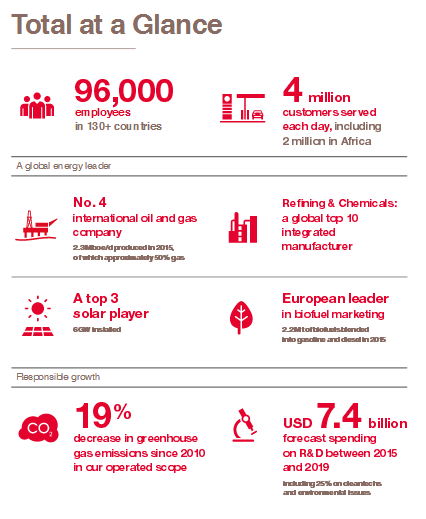
Clear, positive, colorful and friendly way to show how different contact groups of the company benefit from its activities. Total has always demonstrated very high level of visual communication.
 Source: Total CSR Report, 2012

Wednesday, February 27, 2013

Tuesday, February 26, 2013


Thursday, May 26, 2011

Thursday, December 3, 2009

Monday, November 30, 2009

Subscribe to:
Posts (Atom)